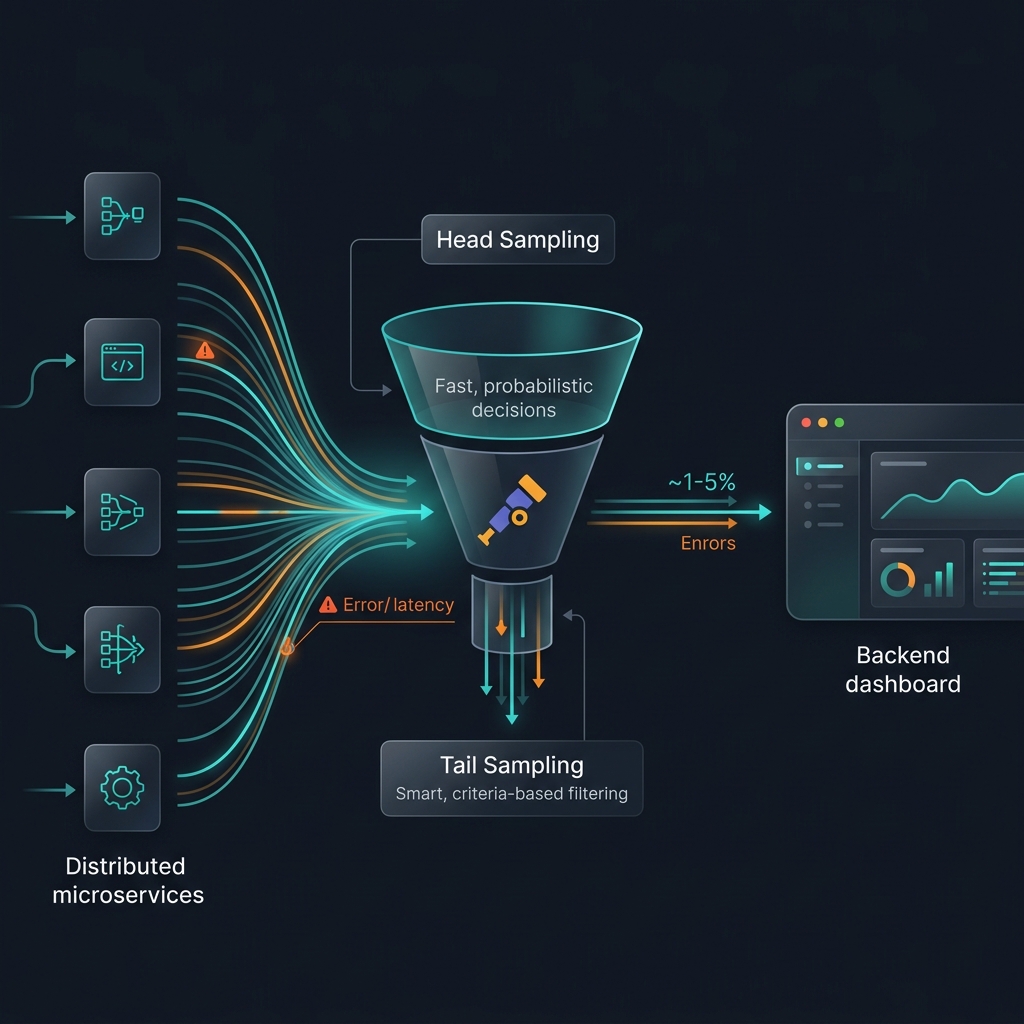
Here’s a belief that kills observability budgets: “if I’m not collecting every trace, I might miss something important.”
It’s intuitive. It’s also wrong — or at least, wrong for most systems running at any meaningful scale.
OpenTelemetry’s own documentation states it plainly: if the large majority of your requests are successful and finish with acceptable latency and no errors, you do not need 100% of your traces to meaningfully observe your applications and systems. You just need the right sampling.
This article explains the statistics behind that claim, walks through the two main sampling strategies, and shows how the OpenTelemetry Collector is the practical component that makes it all work in production.
The Statistics of Representativeness
Sampling isn’t a compromise — it’s an established scientific method. The core principle is representativeness: a smaller group can accurately represent a larger group, and this can be mathematically verified.
The counterintuitive part is what happens at scale. The more data you generate, the less of it you need to get an accurate picture. For high-volume systems, a sampling rate of 1% or lower can very accurately represent the other 99% of data.
Think about how this works in practice. If your service handles 10,000 requests per second with a p99 latency of 150ms:
- 100% sampling: 10,000 traces/second stored → enormous cost
- 1% sampling: 100 traces/second → you still see 100 distinct request journeys every second
- Your p99 latency calculation from those 100 traces will be statistically indistinguishable from the one calculated from all 10,000
The math doesn’t lie. Sampling is sound for aggregate analysis. Where it gets interesting is in which traces you keep — and that’s where strategy matters.
When Sampling Makes Sense (and When It Doesn’t)
Before diving into strategy, it’s worth being honest about when sampling is and isn’t the right move.
Sampling is worth it when:
- You generate 1,000 or more traces per second
- Most of your trace data represents healthy traffic with little variation
- You have clear criteria for what “interesting” data looks like (errors, high latency, specific services)
- You can describe rules that determine whether data should be kept or dropped
- You want to route dropped data to low-cost storage rather than discard it entirely
Sampling might not be right when:
- You generate very little data (tens of traces per second or fewer)
- You only use observability data in aggregate — you can pre-aggregate instead
- Regulations prohibit dropping data entirely
There are also real costs to sampling that teams underestimate:
- Compute cost of running a tail-sampling proxy at scale
- Engineering cost of maintaining sampling rules as your system evolves
- Opportunity cost of missing critical data with poorly designed sampling rules
Sampling done poorly can be more expensive than not sampling at all. The goal is doing it right.
Two Strategies: Head Sampling vs. Tail Sampling
OpenTelemetry defines two fundamentally different moments at which a sampling decision can be made. Choosing between them — or combining them — is the core design decision.
Head Sampling: Fast Decisions at the Start
Head sampling makes the keep/drop decision at the very beginning of a trace, before any spans are processed. The most common form is Consistent Probability Sampling (also called Deterministic Sampling): given a trace ID and a desired percentage, a deterministic hash decides whether the trace is kept.
Request arrives → trace ID generated → hash(trace_id) % 100 < 5? → Keep (5%)
                                                                   → Drop (95%)
Upsides:
- Simple to understand and configure
- Extremely efficient — no state required
- Works at any point in the pipeline, even inside the SDK itself
- Guarantees complete traces (no missing spans for sampled traces)
The critical limitation:
The decision is made before you know anything about the trace. You cannot use head sampling alone to ensure that all error traces are kept, or that slow traces above 500ms are always captured. You’re sampling blindly by probability.
For many systems, this is sufficient. For systems where errors and latency outliers are the critical signals, you need the other strategy.
Tail Sampling: Smart Decisions After the Fact
Tail sampling makes the sampling decision after all (or most) spans in a trace are complete. This means you can inspect the entire trace before deciding whether to keep it.
Request completes → all spans collected → Does it have an error? → Always keep
                                        → Is latency > 1s?      → Always keep
                                        → Otherwise             → Keep 5%
Examples of what tail sampling enables:
- Always keep traces with errors — never miss a failure
- Always keep slow traces — catch latency regressions you’d otherwise sample away
- Sample more traces from a new deployment — give new services higher scrutiny
- Apply different rates per service — high-volume services get 0.1%, low-volume services get 100%
This is dramatically more useful for production debugging. The trade-off is complexity.
The downsides of tail sampling:
- It requires stateful infrastructure. The component making the decision must hold all spans of a trace in memory until the trace is complete. For high-throughput systems, this means significant memory requirements.
- It’s hard to operate. The tail sampler can become a bottleneck. If it falls behind, it may need to fall back to less intelligent sampling or start dropping data.
- It’s often vendor-specific. Many commercial observability platforms offer tail sampling, but it’s tied to their backend.
This is where the OpenTelemetry Collector becomes indispensable.
The OTel Collector: Where Sampling Lives in Your Pipeline
The OpenTelemetry Collector is a vendor-agnostic proxy that sits between your instrumented services and your observability backend. It receives telemetry data, can transform it, and forwards it to one or more destinations.
For sampling, it’s the natural home. Instead of sampling in each SDK independently (which fragments your trace data), the Collector gives you a centralized, configurable, maintainable place to implement your sampling strategy.
[Service A] ─┐
[Service B] ─┼──► [OTel Collector] ──► sampling logic ──► [Backend]
[Service C] ─┘
The Collector’s contrib distribution ships two processors specifically for this:
Probabilistic Sampling Processor (Head Sampling)
The probabilisticsamplerprocessor implements consistent probability sampling. Configure a percentage and it deterministically keeps that fraction of traces.
processors:
  probabilistic_sampler:
    sampling_percentage: 10   # keep 10% of all traces
This is the simplest option and requires no state. It’s ideal when you want to reduce volume uniformly without complex rules.
Tail Sampling Processor (Smart Sampling)
The tailsamplingprocessor is the powerful one. It buffers spans in memory until a trace is complete, then evaluates a set of configurable policies to decide whether to keep or drop it.
processors:
  tail_sampling:
    decision_wait: 10s          # wait up to 10s for all spans
    num_traces: 100000          # max traces to hold in memory
    policies:
      - name: errors-policy
        type: status_code
        status_code: {status_codes: [ERROR]}

      - name: slow-traces-policy
        type: latency
        latency: {threshold_ms: 1000}

      - name: default-policy
        type: probabilistic
        probabilistic: {sampling_percentage: 2}
With this configuration, the Collector will:
- Always keep traces that contain an error span
- Always keep traces that took longer than 1 second
- Keep 2% of everything else
You can compose multiple policies with and/or operators, filter by specific attributes, target individual services, or even route different trace populations to different backends.
Combining Both: Layered Sampling
For very high-volume systems, you can use head sampling and tail sampling together. The common pattern is:
- Head sampling in the SDK (or a gateway Collector) to reduce the initial volume to a manageable level — say, 10% of all traces
- Tail sampling in a second Collector to apply intelligent rules on that reduced volume
This protects the tail sampler from being overloaded while still giving you quality-based filtering on what gets through.
A Practical Sampling Strategy
Here’s a realistic configuration for a production microservices system with mixed traffic volumes:
receivers:
  otlp:
    protocols:
      grpc:
        endpoint: 0.0.0.0:4317

processors:
  tail_sampling:
    decision_wait: 15s
    num_traces: 200000
    policies:
      # 1. Never drop errors — always investigate
      - name: keep-errors
        type: status_code
        status_code: {status_codes: [ERROR]}

      # 2. Never drop slow traces — SLO violations matter
      - name: keep-slow-traces
        type: latency
        latency: {threshold_ms: 500}

      # 3. Keep all traces from recently deployed services
      - name: new-deployment-scrutiny
        type: string_attribute
        string_attribute:
          key: deployment.version
          values: ["v2.4.0"]

      # 4. Default: 1% for healthy, fast traffic
      - name: baseline
        type: probabilistic
        probabilistic: {sampling_percentage: 1}

exporters:
  otlp:
    endpoint: your-backend:4317

service:
  pipelines:
    traces:
      receivers: [otlp]
      processors: [tail_sampling]
      exporters: [otlp]
This configuration achieves what 100% sampling never could: it guarantees you capture every error and every SLO-violating request, while drastically reducing the volume (and cost) of routine, healthy traffic.
The Right Mental Model
Sampling is not about cutting corners. It’s about asking the right question:
What data do I need to answer my questions at 3am?
You don’t need the trace from the 10,000th identical successful /health request. You need the trace from the request that errored. You need the trace that took 4 seconds when everything else took 40ms. You need the trace from the new deployment that started misbehaving.
Head sampling gives you statistical coverage. Tail sampling gives you targeted visibility on what matters. The OpenTelemetry Collector gives you the infrastructure to implement both without modifying a line of application code.
The result: lower costs, better signal-to-noise ratio, and the same (or better) ability to debug your systems.
What’s Next
If you want to go deeper:
- The OpenTelemetry sampling documentation covers the official terminology and options in detail
- The Tail Sampling Processor documentation shows all available policy types
- For the head sampling path, the Probabilistic Sampler documentation covers configuration options
If you’re still figuring out what signals to collect before worrying about sampling, check out The 5 OpenTelemetry Signal Types for the full picture.