If you manage a digital product, an e-commerce store, or a SaaS company, there is one foundational question that determines whether your business thrives or burns cash:
Out of every 1,000 people who hear about your product for the very first time, how many actually end up paying and sticking around?
The answer to that question lies in understanding and optimizing your conversion funnel.
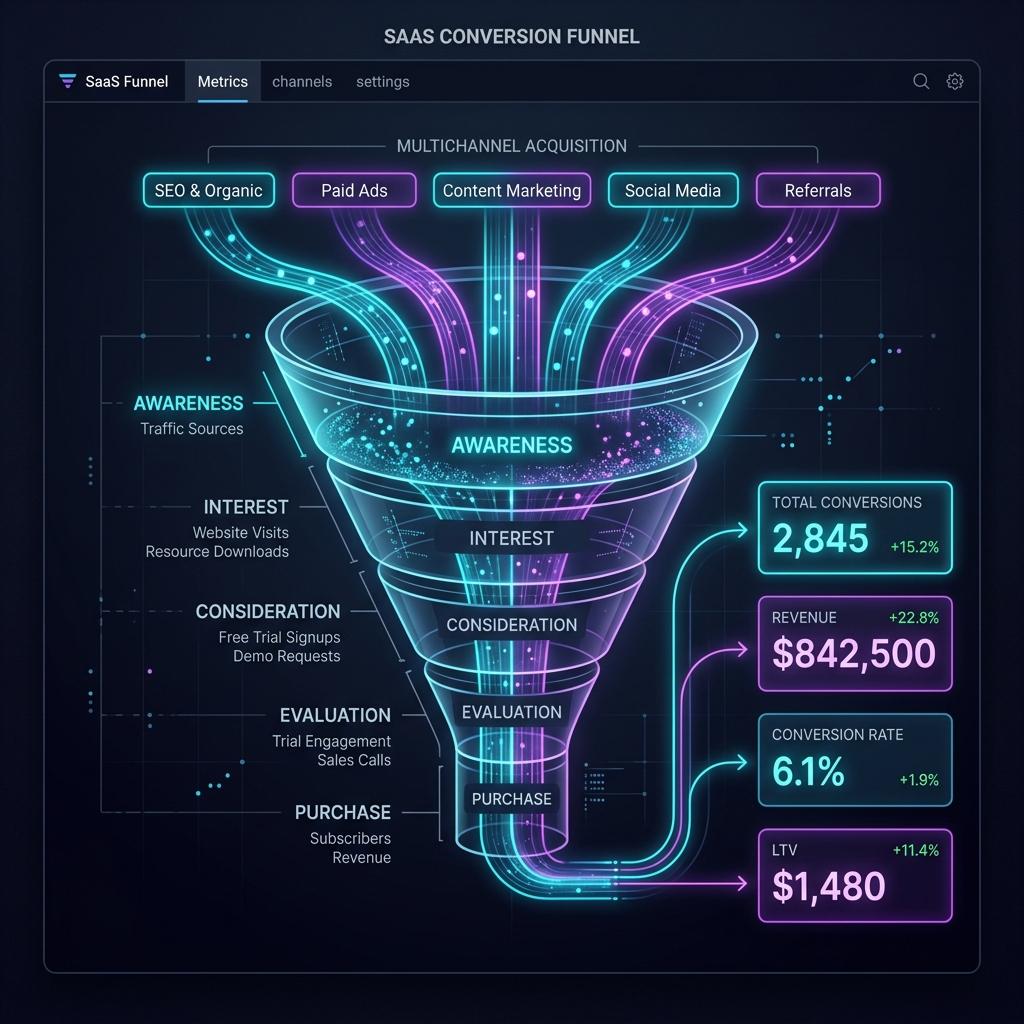
The concept sounds simple enough in textbook theory: picture user progression as a funnel that starts wide at the top (lots of people discover you) and narrows down sequentially (only a percentage perform the desired action).
In today’s multi-channel world, however, the textbook linear funnel is largely broken. A prospective buyer might watch a short video on TikTok, run a Google search three days later, browse two blog posts on their phone, sign up for a newsletter on their laptop, and finally start a free product trial two weeks later.
This guide breaks down what a conversion funnel truly is, explores its critical stages with actionable formulas, explains why funnels leak, and demonstrates how to measure the entire journey by uniting marketing analytics with technical observability.
What Is a Conversion Funnel: The Core Concept
A conversion funnel is a structured representation of the sequential steps a prospective customer takes from their first interaction with your brand to the completion of a high-value business objective.
That ultimate objective—the conversion—depends on your operating model:
- For a SaaS platform: advancing from an anonymous visitor to a registered sign-up, reaching activation, and converting into an active paying subscriber.
- For an E-commerce storefront: viewing a product, adding an item to the cart, entering shipping details, and completing payment.
- For a Mobile App: downloading the app, completing onboarding steps, and initiating an in-app purchase or recurring subscription.
- For a B2B Service: submitting an inquiry form, booking a product demo, or signing a contract.
It is modeled as a funnel because friction is inevitable at each boundary: a percentage of prospective users drop off before reaching the next stage.
Stages of the Modern Funnel: From TOFU to Retention
Marketing historically divided the journey into three macro buckets: TOFU (Top of the Funnel), MOFU (Middle of the Funnel), and BOFU (Bottom of the Funnel). For modern digital products, however, the funnel doesn’t stop at the initial transaction—it extends into onboarding, activation, and customer retention:
                  ┌─────────────────────────────────┐
  1. AWARENESS    │  Organic Search, TikTok, Ads    │  100% of prospects
  (TOFU)          └────────────────┬────────────────┘
                                   │  (Drop-off: 65%)
                  ┌────────────────▼────────────────┐
  2. INTEREST     │  Website visits, blog readership│   35%
  (MOFU)          └────────────────┬────────────────┘
                                   │  (Drop-off: 50%)
                  ┌────────────────▼────────────────┐
  3. CONSIDERATION│  Pricing, features, case studies│  17.5%
  (MOFU/BOFU)     └────────────────┬────────────────┘
                                   │  (Drop-off: 60%)
                  ┌────────────────▼────────────────┐
  4. CONVERSION   │  Signup / Trial start / Checkout│    7.0%
  (BOFU)          └────────────────┬────────────────┘
                                   │  (Drop-off: 40%)
                  ┌────────────────▼────────────────┐
  5. RETENTION    │  Active usage, renewals, LTV    │    4.2%
  (Post-Funnel)
1. Awareness & Reach (Top of Funnel - TOFU)
This is the user’s initial touchpoint. At this phase, they aren’t necessarily looking for your specific software; they have a problem, an interest, or were engaged by relevant content.
- Typical channels: Organic Google searches (Search Console), short-form TikTok videos, paid ad campaigns (Meta, Google, LinkedIn), word of mouth.
- Key metrics: Impressions, reach, Click-Through Rate (CTR), and Cost per Mille (CPM).
2. Interest & Exploration (Middle of Funnel - MOFU)
The visitor clicks through and lands on your digital footprint. Here they evaluate whether what you build directly solves their problem.
- Typical behavior: Reading your landing page, browsing articles, reviewing product screenshots, or exploring interactive demos.
- Key metrics: Active sessions, bounce rate, average session duration, pages per session, and scroll depth.
3. Consideration & Intent (Middle to Bottom of Funnel)
The prospect is aware of your brand and is actively comparing your solution against competitors or alternative workflows.
- Typical behavior: Visiting your
/pricingpage, inspecting technical documentation, checking available integrations, or initiating sign-up. - Key metrics: Pricing page visits, high-intent CTA clicks (“Start Free Trial”, “Book a Demo”), checkout starts, and onboarding initiation rates.
4. Conversion & Activation (Bottom of Funnel - BOFU)
The critical inflection point where a visitor commits and becomes a registered user or a paying customer.
- Typical behavior: Completing registration, validating email credentials, submitting payment via Stripe, or completing the primary product onboarding flow.
- Key metrics: Overall Conversion Rate (CR), Customer Acquisition Cost (CAC), checkout completion rate, and time-to-activation (the moment of realized value).
5. Retention & Lifetime Expansion (Post-Funnel)
Acquiring users only to lose them 30 days later is a financial treadmill. This phase tracks whether customers realize ongoing, compounding value.
- Key metrics: Monthly churn rate, Net Revenue Retention (NRR), Customer Lifetime Value (LTV), and LTV-to-CAC ratio.
Core Mathematical Formulas You Must Track
Optimizing a funnel requires isolating performance step by step rather than relying on a blended high-level figure.
Step Conversion Rate
Measures the efficiency of a single progression between two adjacent milestones: $$\text{Step Conversion Rate} = \left( \frac{\text{Users completing step } N}{\text{Users reaching step } N-1} \right) \times 100$$
Example: If 2,500 people visit your pricing page and 300 click “Get Started”: $$\text{Step Conversion Rate} = \left( \frac{300}{2500} \right) \times 100 = 12%$$
Drop-off Rate (Funnel Leakage)
The percentage of potential users who abandoned at a specific stage: $$\text{Drop-off Rate} = 100% - \text{Step Conversion Rate}$$ In the example above, the pricing page drop-off rate is 88%. Pinpointing the steepest drop-off highlights exactly where your conversion rate optimization (CRO) efforts should focus.
Why Traditional Funnels Fail Modern Teams
Many product teams fall into the trap of analyzing their funnel as a sterile, linear pipe. In real-world environments, two major distortions emerge:
1. The Non-Linear, Multi-Touch Reality
Users almost never convert in one clean, uninterrupted session. If your attribution relies solely on traditional last-click models, Google Analytics will assign 100% of the conversion credit to “Direct” or “Organic Search”, ignoring the fact that the customer initially discovered you through an ad or video campaign two weeks prior. Without unified cross-channel tracking, you risk cutting ad spend on top-of-funnel channels that actually drove your best prospects.
2. Invisible Technical Leaks
This is the single most pervasive blind spot in modern product management. When growth teams see checkout drop-offs spike by 25%, the instinct is almost always to overhaul the marketing copy, change button colors, or offer discounts.
In reality, the problem is often technical, not persuasive:
- A slow database query makes user profile verification take 4.5 seconds on mobile networks.
- A third-party cookie consent script or analytics tag blocks the checkout iframe from rendering on specific browser versions.
- An authentication API intermittently throws HTTP 504 Gateway Timeouts.
When marketing analytics tools (GA4) are isolated from engineering observability, teams debate assumptions while users quietly leave.
Diagnosing and Fixing Funnel Leaks: The Unified Framework
To turn a leaky funnel into a predictable growth engine, top-tier teams implement a four-pillar framework:
STEP 1: Map clear, unambiguous milestones
        Define the exact telemetry event (URL change, click ID, webhook payload) for each transition.

STEP 2: Unify your sources into a shared context
        Cross-reference top-of-funnel acquisition (TikTok, Search Console, GA4) with bottom-of-funnel reality (Stripe).

STEP 3: Monitor technical performance alongside UX
        Track Core Web Vitals (LCP, INP), backend latency, and client-side JavaScript errors across funnel steps.

STEP 4: Leverage AI for automated pattern detection
        Let an intelligent analytics platform flag unusual cohort drop-offs without manual dashboard hunting.
Real-World Example: From Symptom to Root Cause
Consider how this works in practice using an integrated platform like Observability Insight:
- The detected anomaly: Overall signup-to-paid conversion dipped from 5.4% to 3.8% over the past seven days.
- Cross-channel correlation: Automated AI analysis reveals that desktop organic search conversions remained steady at 6.1%, but mobile traffic originating from video campaigns suffered a severe collapse down to 1.1%.
- The technical root cause: The mobile landing page experienced an asset bundle regression that pushed Time to Interactive (TTI) above 5 seconds on 4G connections. Over 70% of mobile users bounced before the primary CTA rendered.
- Actionable remediation: Compress hero assets and defer non-critical scripts. Result: Mobile conversion returns to baseline within 24 hours, protecting campaign ROI.
Conclusion
A conversion funnel is not just a static slide for an executive presentation; it is the vital diagnostic system of your business.
By moving away from isolated spreadsheets and treating your funnel as an interconnected ecosystem—where marketing reach, product user experience, and technical reliability converge—you gain the clarity needed to make confident, high-impact growth decisions.