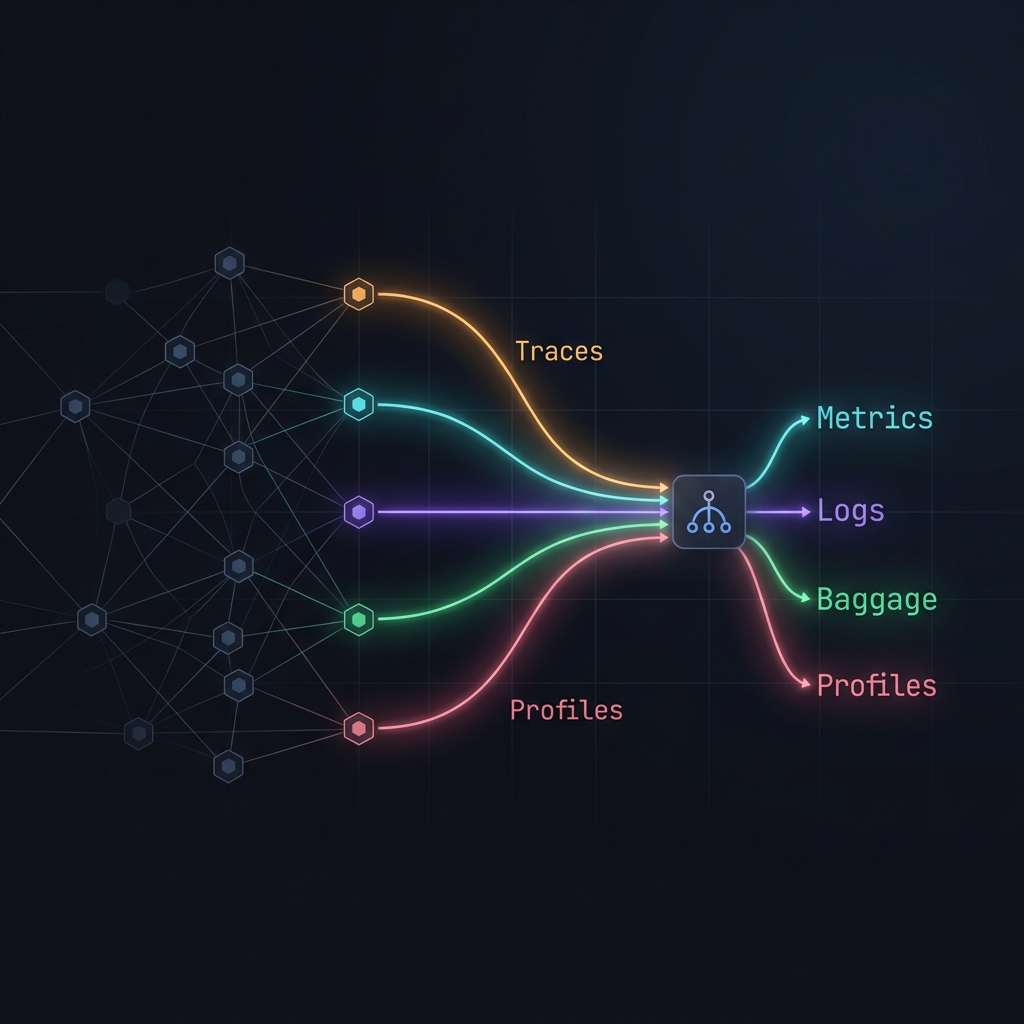
OpenTelemetry is not just a tracing framework. It’s a complete telemetry platform that defines five types of signals: the fundamental categories of data you can collect from your systems.
Most teams know traces and, if they’re lucky, metrics. But understanding all five signals — and more importantly, knowing when to use each — is what separates basic instrumentation from a real observability strategy.
What Is a Signal in OpenTelemetry?
A signal is a standardized mechanism for capturing a specific type of telemetry data. Each signal has its own data model, its own export protocol (via OTLP), and its own semantics. They are not interchangeable — each one answers different questions.
The question you should be asking is: what question do I need to answer? The answer determines which signal to use.
1. Traces — What did the system do to handle this request?
A trace represents the complete journey of a request through your system. It is composed of spans: units of work with a start time, end time, a name, and context attributes.
[Trace: POST /checkout]
├── [Span: api-gateway] 12ms
│   ├── [Span: auth.validate] 3ms
│   ├── [Span: order.process] 7ms
│   │   ├── [Span: inventory.check] 2ms  → db: inventory
│   │   └── [Span: payment.charge] 4ms  → external: stripe
│   └── [Span: notification.send] 1ms
What makes traces unique is causal correlation: each span knows its parent. You can see exactly what called what, in what order, and how long each part took.
When to use traces
- To understand the latency of a specific request and where time is being lost
- To debug intermittent errors that depend on execution context
- To visualize dependencies between services in distributed systems
- To identify which service is the bottleneck for a specific operation
What traces don’t give you
Traces are expensive to store and are therefore usually sampled. They are not good for answering aggregate questions like “how many requests failed in the last hour?” — that’s what metrics are for.
2. Metrics — How is the system performing right now?
Metrics are numerical measurements aggregated over time. Unlike traces, they don’t describe an individual request — they describe the system’s behavior as a whole.
OpenTelemetry defines several metric instruments depending on the type of data you want to capture:
| Instrument | Use case |
|---|---|
Counter | Values that only go up: total requests, total errors |
UpDownCounter | Values that go up and down: active connections, queue size |
Histogram | Distributions: request latency, payload sizes |
Gauge | Instantaneous value: memory usage, CPU temperature |
val meter = openTelemetry.getMeter("order-service")

// Count processed orders
val ordersProcessed = meter.counterBuilder("orders.processed")
    .setDescription("Total orders processed")
    .setUnit("orders")
    .build()

// Measure processing latency
val processingTime = meter.histogramBuilder("order.processing.duration")
    .setDescription("Order processing duration")
    .setUnit("ms")
    .build()

fun processOrder(order: Order) {
    val start = System.currentTimeMillis()
    // ...
    processingTime.record(System.currentTimeMillis() - start)
    ordersProcessed.add(1, Attributes.of(
        AttributeKey.stringKey("order.type"), order.type
    ))
}
When to use metrics
- For real-time system health dashboards
- For alerting: metrics are efficient and cheap to evaluate continuously
- For SLOs: reliability objectives are measured on metrics, not traces
- For long-term trends: did memory usage grow 20% this month?
The complementarity with traces
Metrics tell you something is wrong — “the error rate jumped to 5%”. Traces tell you why it’s wrong — “95% of those errors come from Enterprise plan users calling the /export endpoint”. Use them together.
3. Logs — What happened exactly at this precise moment?
Logs are textual records of discrete events with a timestamp. They’re the oldest and most familiar signal, but OpenTelemetry adds something crucial: automatic correlation with traces.
When you emit a log within the context of an active span, OpenTelemetry automatically attaches the trace_id and span_id to the log. This transforms isolated log entries into data you can navigate directly from a trace.
// Inside an active span, the logger inherits context
val logger = LoggerFactory.getLogger(OrderService::class.java)

fun processOrder(orderId: String) {
    tracer.spanBuilder("order.process").startSpan().use { span ->
        span.setAttribute("order.id", orderId)

        logger.info("Starting order processing") // trace_id automatically attached

        val order = fetchOrder(orderId)

        if (order.hasRiskFlag) {
            logger.warn("Order flagged as high risk",
                kv("order.id", orderId),
                kv("risk.score", order.riskScore)
            )
        }

        logger.info("Order processed successfully",
            kv("order.amount", order.total),
            kv("payment.provider", order.paymentProvider)
        )
    }
}
When to use logs
- For discrete events that need rich textual description: errors with stack traces, complex business events
- For debugging context that doesn’t fit in span attributes
- For auditing: “user X modified permission Y at 14:32:07”
- For low-cardinality events where free text is more expressive than a metric
The most common mistake with logs
Treating logs like it’s 2010: plain text messages with no structure, no correlation with other signals, no business context. A well-designed log in 2024 is structured (JSON), carries the trace_id of the current operation, and has typed attributes that can be filtered.
4. Baggage — How do I propagate context across services?
Baggage is the least known signal and probably the most misunderstood. It’s not telemetry in itself — it’s a context propagation mechanism that travels alongside requests through your entire distributed system.
Think of it as metadata you attach to a request at the edge of your system that is available in any service participating in that request, without any intermediate service having to explicitly pass it along.
// At the API Gateway, when the request arrives
val baggage = Baggage.current().toBuilder()
    .put("user.tier", "enterprise")
    .put("user.region", "eu-west")
    .put("feature.flags", "new-checkout,beta-pricing")
    .build()

// Baggage automatically travels to all downstream services
// via HTTP headers: baggage: user.tier=enterprise,user.region=eu-west

// In the pricing service, 3 hops later
val userTier = Baggage.current().getEntryValue("user.tier")
val userRegion = Baggage.current().getEntryValue("user.region")
// No need for anyone to have explicitly passed it
When to use Baggage
- To propagate user identity information (tier, region, ID) without modifying all function signatures
- To propagate active feature flags without every service having to query them
- To enrich spans and logs in downstream services with context from the request origin
- To implement routing or prioritization logic based on client attributes
The critical warning
Baggage has a network cost: every value you put in it travels in the HTTP headers of all requests in the chain. Don’t put large or sensitive data in it. Keep keys short, values small, and data non-PII.
// BAD: don't do this
baggage.put("user.full_profile", userProfileJson) // could be KB of data

// GOOD: identifiers only
baggage.put("user.id", userId)
baggage.put("user.tier", "enterprise")
5. Profiles — What is consuming my system’s resources?
Profiles (also called Continuous Profiling) are the newest signal in OpenTelemetry, currently in active specification. They capture the call stack of the process at regular intervals, letting you see what code is consuming CPU, memory, or I/O time.
Unlike traces, which require manual instrumentation, profiling works at the process level: the profiler samples the program state every few milliseconds without you having to modify your code.
CPU Profile — order-service — snapshot every 10ms
├── 42% → OrderService.processOrder
│   ├── 28% → DatabaseClient.executeQuery
│   │   └── 28% → JDBC.prepareStatement  ← real bottleneck
│   └── 14% → PricingEngine.calculate
├── 35% → GC Threads                     ← memory pressure
└── 23% → Netty I/O Threads
When to use Profiles
- To find where CPU is actually being consumed in production, not in synthetic load tests
- To investigate performance regressions without an obvious culprit in the traces
- To optimize infrastructure costs: what code is burning the most compute?
- To correlate CPU spikes with specific traces — “this CPU spike occurred during these traces”
The current state of Profiles in OTel
The Profiles specification in OpenTelemetry is under active development. Working implementations already exist (Parca, Pyroscope, Grafana Beyla), and the pprof format is the de facto standard today. Native OTLP integration is coming, which will allow correlating profiles directly with traces and logs in the same pipeline.
How the five signals fit together
No signal is better than the others — they are different tools for different questions. A mature observability strategy uses all five in a complementary way:
| Question | Signal |
|---|---|
| What did the system do to handle this request? | Traces |
| How many requests are failing right now? | Metrics |
| What happened exactly at 14:32:07? | Logs |
| What context does this service have about the user? | Baggage |
| What code is burning CPU in production? | Profiles |
The typical incident flow is: a metric alerts you that something is wrong → a trace shows you which operation is failing → a log gives you the exact error detail → a profile helps you understand if there’s an underlying performance regression. Baggage, meanwhile, ensures user context travels automatically through the entire chain.
Conclusion
OpenTelemetry is a deliberate bet on unification: one SDK, one protocol (OTLP), five signals. Before OTel, each signal had its own agent, its own format, and its own vendor. Today you can instrument your system once and send all types of telemetry to the backend of your choice.
But technical unification doesn’t hand you the strategy. It’s still your job to decide which signals to enable, at what granularity to instrument, and what questions you need your system to be able to answer at 3am. Start with the questions, not the signals.
If you want to go deeper on designing spans that actually help, I recommend also reading why your OpenTelemetry setup is generating useless spans.