Open your browser on a Monday morning.
Tab 1: Google Analytics 4.
Tab 2: Google Search Console.
Tab 3: TikTok Business Center.
Tab 4: Meta Ads Manager.
Tab 5: Stripe Dashboard.
Tab 6: HubSpot or your CRM.
Tab 7: Your application logs or server monitoring console.
On paper, your team has never had more access to data. In reality, you spend the first forty minutes of the day attempting to answer a seemingly straightforward question from a co-founder or team member: “Why did conversions drop over the weekend if ad spend was up 20%?”
The treasure hunt begins. On Meta or TikTok, impressions increased, but click-through rates fell. In GA4, you see an influx of sessions with a 70% bounce rate, yet attribution assigns half of them to “Direct” or “Unassigned”. In Stripe, successful payments dipped by 15%, while your application error logs show intermittent latency spikes on the payment webhook that nobody on the marketing team ever heard about.
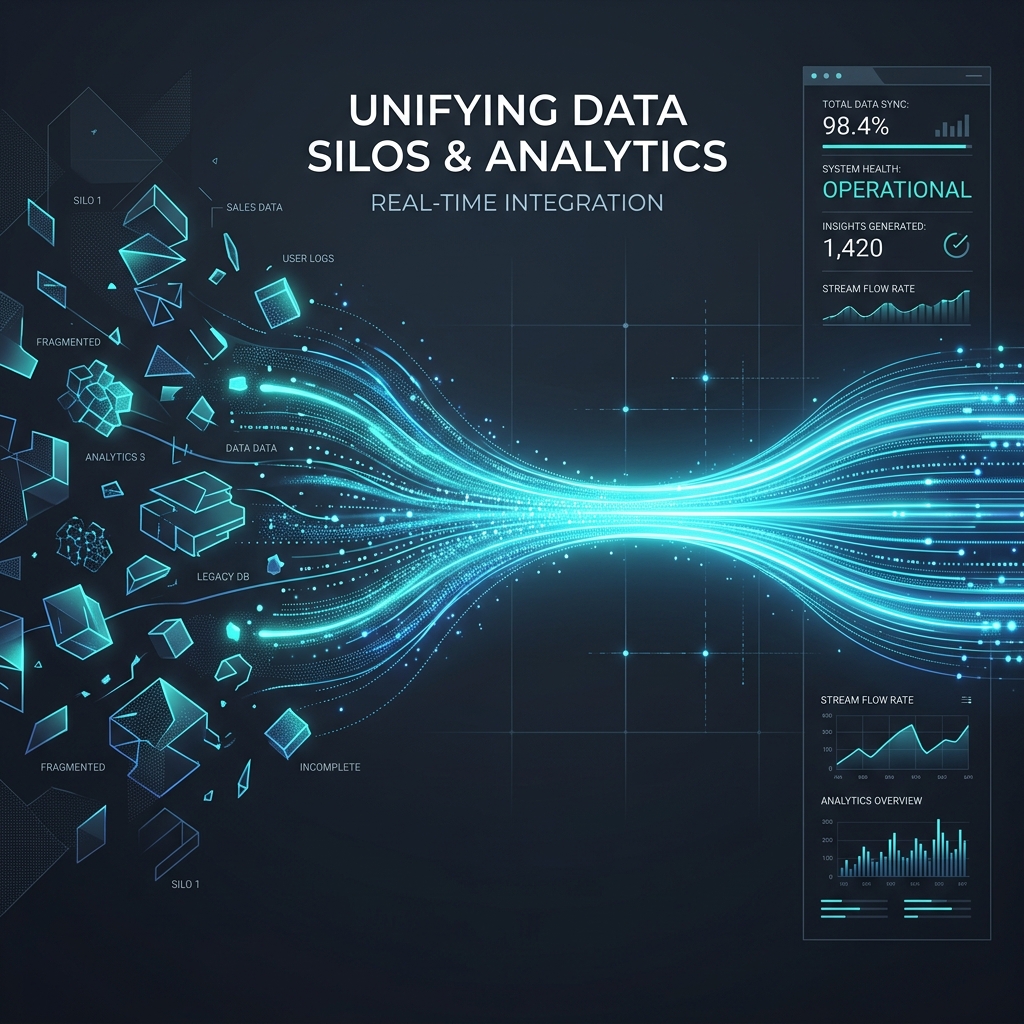
Welcome to the biggest time and revenue drain in modern digital teams: fragmented analytics.
The Paradox of Tool Sprawl
Building software and launching marketing initiatives has never been faster or cheaper. In a single week, you can deploy three microservices, launch two dedicated landing pages on a subdomain, kick off TikTok ad campaigns, and publish ten SEO-targeted articles.
Yet, as the barrier to creating things has collapsed, the barrier to understanding how everything performs together has skyrocketed.
Every tool introduced into your marketing and engineering stack comes with its own:
- Proprietary data model.
- Arbitrary attribution window (1-day click? 7-day view?).
- Conflicting definition of what constitutes a “user”, a “session”, or a “conversion event”.
- Siloed dashboard designed to prove that its specific channel is driving all your growth.
The outcome isn’t deeper visibility. It is blindness caused by excessive noise.
The Three Hidden Taxes of Data Silos
When your numbers live scattered across ten disconnected services, your team pays three steep, invisible taxes every single day:
1. The Manual Reconciliation Tax (The CSV Nightmare)
How many hours each month does your team spend downloading CSV files just to line up marketing ad spend with real Stripe revenue and Search Console impressions?
Manual spreadsheet reconciliation is error-prone, static, and perpetually late. By the time you notice that a campaign burned $3,000 on leads who dropped off during signup because an input field broke on mobile Safari, that money is long gone.
2. The Cross-Context Blindness Tax
Acquisition channels and product infrastructure do not exist in isolation, yet our tools pretend they do:
- Marketing optimizes cost per click without knowing whether the onboarding API is under heavy load or whether mobile TTFB (Time to First Byte) jumped to 3.8 seconds after the last deployment.
- Product and Engineering monitor CPU spikes and HTTP 500 errors, completely oblivious to silent UX friction or drop-offs in a checkout flow during a live campaign.
- Leadership and Finance track revenue numbers, unable to isolate which marketing channels actually generate customers with high Lifetime Value (LTV) versus high initial churn.
3. The Dashboard Fatigue Tax
There is a persistent myth that the cure for disconnected data is building yet another dashboard in Looker Studio or Grafana with 35 line charts.
In reality, nobody has the cognitive bandwidth to decipher 35 charts every day. A chart shows you what number moved, but it cannot explain why it moved or what you should do next. It forces you to mentally stitch together causes and effects without the underlying connective tissue.
| Traditional Approach (Silos) | Unified Analytics & Observability Platform |
|---|---|
| 10 tabs open with contradictory metrics | A single, normalized source of truth |
| Manual reconciliation in spreadsheets | Automated ingestion and continuous data sync |
| Technical performance and marketing are isolated | Direct correlation between system health and conversion rates |
| Static charts requiring manual interpretation | Proactive anomaly detection and actionable suggestions |
| Decisions based on gut feelings or stale reports | Fast decisions backed by cross-channel context |
What Unifying Observability and Analytics Actually Means
Historically, “observability” was strictly reserved for backend engineers: OpenTelemetry traces, CPU profiles, and Kubernetes logs. On the other side of the building, “analytics” was the domain of growth teams: click counts, bounce rates, CPCs, and keywords.
That divide is artificial and counterproductive.
In any online business, your server response times, deployment stability, acquisition funnels, and Stripe transaction logs are components of a single, interconnected system.
Centralization doesn’t mean dumping unformatted JSON dumps into a massive data lake that requires complex SQL queries to query. True centralization achieves three things:
┌─────────────────────────────────────────────────────────────┐
│                        DATA SOURCES                         │
│   GA4  •  Search Console  •  TikTok  •  Meta  •  Stripe ... │
└──────────────────────────────┬──────────────────────────────┘
                               │ (5-minute zero-code setup)
                               ▼
┌─────────────────────────────────────────────────────────────┐
│                 UNIFIED SEMANTIC DATA LAYER                 │
│      Normalized sessions, attribution, events, and health   │
└──────────────────────────────┬──────────────────────────────┘
                               │ (AI & Cross-channel patterns)
                               ▼
┌─────────────────────────────────────────────────────────────┐
│                       CLEAR ANSWERS                         │
│  1. What happened? (Organic traffic surged 32%)             │
│  2. Why did it happen? (Targeted landing pages in France)   │
│  3. What to do next? (Expand high-engagement Alsace topics) │
└─────────────────────────────────────────────────────────────┘
1. Zero-Friction Connectivity
You shouldn’t need a dedicated data engineering team to link Google Analytics 4, Search Console, and TikTok. Integrations should connect in minutes via authorized APIs that handle ingest, deduplication, and schema normalization out of the box.
2. A Consistent Semantic Model
A user interaction must make sense whether that person arrived via a viral TikTok clip, an organic Google search query, or a referral link. Unification gives you an uninterrupted view of the journey: what they encountered, how the application responded, and whether they converted.
3. Moving from Raw Data to Actionable Insights with AI
This is where the true paradigm shift occurs. AI shouldn’t just summarize generic summaries; it must act as an indefatigable data analyst running 24/7 correlation checks across your entire stack.
Instead of hunting for why your checkout completion dipped, an intelligent system surfaces the root cause:
“Mobile traffic from the latest TikTok campaign increased by 45%, but the overall signup rate dropped by 2.1%. 82% of drop-offs occurred during authentication due to a 2.5-second latency degradation in the OAuth provider callback.”
That is the difference between an inert screen of metrics and a platform that provides immediate operational clarity.
How to Start Streamlining Your Analytics Today
If you find your team drowned in disconnected metrics and dozens of browser tabs, you don’t need a multi-month overhaul. Take these focused steps:
- Audit active tracking tools: Take a hard inventory of every analytics script and tracking pixel on your site. If nobody has logged into a tool for six months, tear it out—it only slows down your pages and muddies your data.
- Define your core North Star metrics: Pick the 3 to 5 numbers that actually move the needle for your business (e.g., blended acquisition cost, product activation rate, net MRR expansion, 30-day retention).
- Bring key sources into a single pane of glass: Connect your primary acquisition drivers (GA4, Search Console, top social channels) alongside your business telemetry into a centralized platform like Observability Insight.
- Prioritize action over data hoarding: Stop hoarding gigabytes of uninspected logs and tables. What determines your growth is how fast your team identifies an anomaly, understands the reason behind it, and executes the right fix.
Final Thoughts
More tools have never guaranteed more clarity. In modern digital business, the winning advantage doesn’t belong to the team with the most monitor displays or the most complex spreadsheets. It belongs to the team that can connect the dots between marketing, product performance, and revenue into one coherent picture.
Stop acting as the human middleware between disconnected dashboards. Let your data work together for you.