You’ve set your container memory limit to 2GB. Your JVM heap is configured at 1GB with -Xmx1g. The math seems right. And yet, every few days, your pod gets OOM killed.
This is one of the most common — and most misunderstood — production issues in containerized JVM workloads. The problem isn’t the heap. It’s everything else.
The Memory the JVM Doesn’t Tell You About
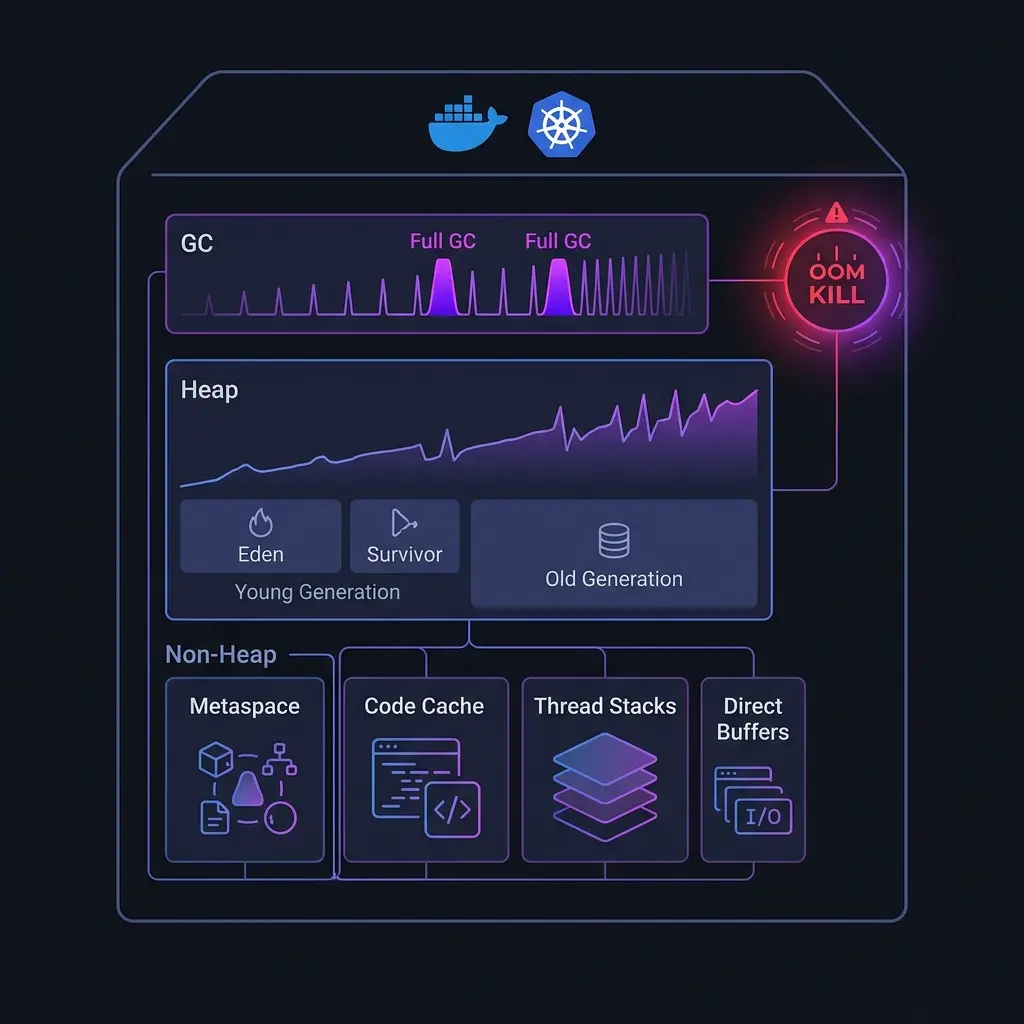
JVM heap usage, visible in your jvm.memory.used metrics, is only part of the picture. A running JVM process consumes memory in several regions, most of which are invisible to standard monitoring:
| Region | What it contains |
|---|---|
| Heap | Objects, what -Xmx controls |
| Metaspace | Class metadata, loaded bytecode |
| Code cache | JIT-compiled native code |
| Thread stacks | One stack per thread, ~512KB–1MB each |
| Direct buffers | NIO off-heap memory, often used by networking code |
| Mapped files | Memory-mapped files, native libraries |
| JVM internals | GC data structures, symbol tables |
When your container OOM killer fires, it’s looking at the total resident set size (RSS) of the process — the sum of all of these. A JVM using 1GB of heap can easily have 1.4–1.6GB of total RSS, and with a 2GB container limit, you don’t have much headroom.
How to Find What’s Actually Using Memory
The first step is getting visibility into all memory regions, not just the heap.
Add JVM memory metrics to your existing telemetry. If you’re using OpenTelemetry, the JVM instrumentation agent automatically captures:
jvm.memory.used{area="heap"}
jvm.memory.used{area="nonheap"}    # metaspace + code cache
jvm.thread.count
jvm.gc.collections.elapsed
But that’s still not enough for OOM debugging. You need process-level metrics:
# RSS of your JVM process
cat /proc/<pid>/status | grep VmRSS

# Detailed memory map
cat /proc/<pid>/smaps_rollup
Or with JVM-native tools:
# Native memory tracking — add this to JVM flags
-XX:NativeMemoryTracking=summary

# Then query it at runtime
jcmd <pid> VM.native_memory summary
The VM.native_memory output will show you exactly how much memory each JVM subsystem is consuming. You’ll often find surprises here.
You can also query memory pools programmatically from your Kotlin/Java application:
import java.lang.management.ManagementFactory

fun printMemoryStats() {
    val memBean = ManagementFactory.getMemoryMXBean()
    val heapUsage = memBean.heapMemoryUsage
    val nonHeapUsage = memBean.nonHeapMemoryUsage

    println("Heap used: ${heapUsage.used / 1024 / 1024} MB / ${heapUsage.max / 1024 / 1024} MB")
    println("Non-Heap used: ${nonHeapUsage.used / 1024 / 1024} MB")

    ManagementFactory.getMemoryPoolMXBeans().forEach { pool ->
        val usage = pool.usage
        println("${pool.name}: ${usage.used / 1024 / 1024} MB used")
    }
}
The Metaspace Trap
Metaspace is where the JVM stores class metadata. Unlike the old PermGen, it has no fixed upper bound by default — it grows until the OS says no.
In containerized environments, this means metaspace can silently grow to fill all available memory. It typically happens when:
- You’re using dynamic class generation (reflection-heavy frameworks, bytecode manipulation)
- You have classloader leaks (common in apps that reload code dynamically)
- You’re using a framework that generates proxy classes at startup (Spring, Hibernate)
Set an explicit cap:
-XX:MaxMetaspaceSize=256mThis will cause an OutOfMemoryError: Metaspace instead of a silent OOM kill — which is actually better, because it’s detectable and alertable.
To diagnose whether metaspace is growing unexpectedly:
jcmd <pid> VM.native_memory summary | grep MetaspaceIf you see it growing over days in a long-running process, you likely have a classloader leak.
GC Storms and Container CPU Limits
GC behavior in containers is complicated by CPU limits. By default, JVM ergonomics (the system that auto-configures the JVM based on available resources) reads the number of CPUs to determine GC thread count. In a container with 8 host CPUs but a 2-CPU limit, the JVM might still spawn 8 GC threads — which then get throttled by the CPU limit, turning GC pauses from milliseconds into seconds.
Fix: Explicitly set GC thread counts and use container-aware JVM flags:
# Container awareness (on by default in JDK 8u191+, JDK 10+)
-XX:+UseContainerSupport

# Explicit GC threads relative to CPU limit
-XX:ParallelGCThreads=2
-XX:ConcGCThreads=1

# Use G1GC for most server workloads
-XX:+UseG1GC
-XX:MaxGCPauseMillis=200
To see what the JVM thinks it has available:
java -XX:+PrintFlagsFinal -version 2>&1 | grep -E "ActiveProcessor|GCThreads"You can also check this at runtime from Kotlin:
import java.lang.management.ManagementFactory

fun printGcStats() {
    val runtime = Runtime.getRuntime()
    println("Available processors: ${runtime.availableProcessors()}")

    ManagementFactory.getGarbageCollectorMXBeans().forEach { gc ->
        println("GC: ${gc.name}, collections: ${gc.collectionCount}, time: ${gc.collectionTime}ms")
    }
}
Diagnosing Off-Heap Leaks
Off-heap memory leaks are the hardest to find because your heap metrics look fine. The process keeps growing, GC runs normally, but RSS creeps up until the OOM killer fires.
Common culprits:
Direct ByteBuffers — allocated with ByteBuffer.allocateDirect(), common in Netty-based frameworks (Vert.x, Quarkus reactive, gRPC). These are not collected by normal GC:
# Track direct buffer usage
jcmd <pid> VM.native_memory summary | grep "Internal"
You can monitor direct buffer usage from your application:
import java.lang.management.ManagementFactory
import javax.management.ObjectName

fun getDirectBufferUsage(): Long {
    val mbs = ManagementFactory.getPlatformMBeanServer()
    val name = ObjectName("java.nio:type=BufferPool,name=direct")
    return mbs.getAttribute(name, "MemoryUsed") as Long
}
JNI libraries — native code called via JNI manages its own memory outside the JVM. Leaks here are invisible to all JVM tooling and require native-level profiling with tools like Valgrind or Heaptrack.
Memory-mapped files — frameworks like Chronicle Map, RocksDB, or MapDB use mmap. These show in RSS but not in heap metrics.
For a running production process, you can get a memory map snapshot:
cat /proc/<pid>/smaps | grep -E "^(Size|Rss|Anonymous)" | \
  awk '/Size/{s=$2} /Rss/{r=$2} /Anonymous/{a=$2; print s, r, a}' | \
  sort -rn -k2 | head -20
This shows you the 20 largest memory regions by RSS, which often points directly to the leak.
A Practical Sizing Formula
When sizing JVM containers, I use this formula as a starting point:
Container limit = Xmx + 400MB (metaspace + code cache)
               + (thread count × 1MB) (thread stacks)
               + 200MB (direct buffers, JVM internals)
               + 20% headroom
For a typical service with -Xmx1g, 100 threads, and moderate direct buffer usage:
1024 + 400 + 100 + 200 = 1724MB × 1.2 = ~2.1GBSet your container limit to 2.5GB and your -Xmx to 1GB. That 500MB gap is not waste — it’s the space the JVM needs to operate without getting killed.
The Metrics to Alert On
Once you have visibility into all memory regions, set alerts on:
- Off-heap usage (
jvm.memory.used{area=nonheap}approaching its max) - GC overhead — if more than 5% of CPU time is spent in GC, you have a problem
- GC pause duration — p99 pauses above 500ms affect your tail latency
- Container memory usage — alert at 80% of limit, not 95%
That last point is critical. By the time your memory usage hits 95% of the container limit, you have seconds before the OOM kill. At 80%, you have time to investigate, scale, or flush caches.
The JVM is an extraordinarily well-instrumented runtime — but only if you know where to look. Most teams instrument the heap and miss everything else. Don’t be that team at 3am when your pods start dying.