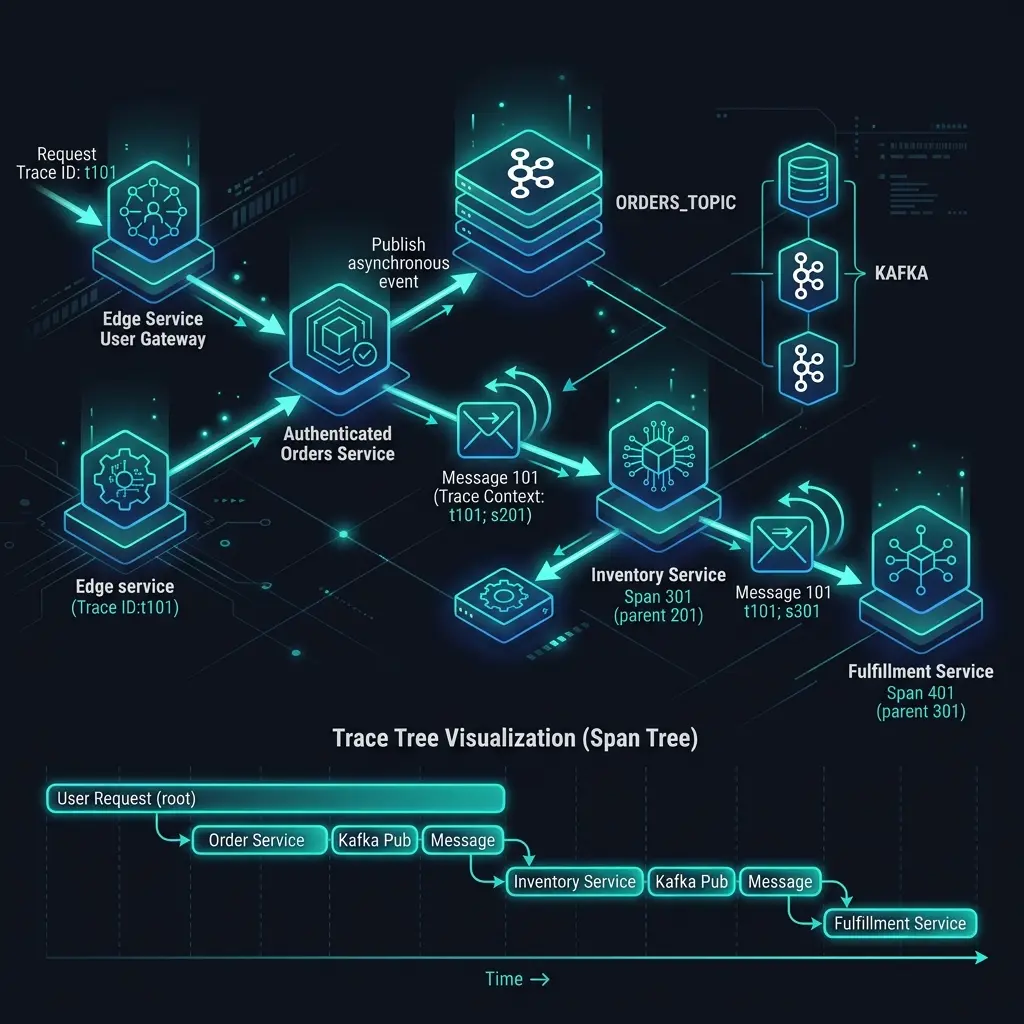
Distributed tracing works beautifully in synchronous systems. You make an HTTP call, the trace context propagates through the traceparent header, and on the other side you see a clean span tree that tells you exactly what happened.
Now add a message queue.
Suddenly the trace breaks. The consumer service starts a new root span. Your Kafka topic becomes an observability black hole. You can see that a message was published and you can see it was eventually processed, but you’ve lost the causal link between them. In production, when a message processing job is slow or failing, you’re flying blind.
This is one of the most common observability gaps I find in distributed systems. The good news is it’s solvable — but the solution requires understanding why it breaks first.
Why Trace Context Gets Lost at Queue Boundaries
HTTP tracing works because headers travel with the request. The traceparent header carries the trace ID and parent span ID, and every OpenTelemetry SDK knows how to extract it automatically.
Message queues don’t have this mechanism by default. When you publish a message to Kafka, you’re serializing a payload — not an HTTP request. Unless you explicitly inject trace context into the message headers, it disappears.
The pattern looks like this:
// WITHOUT trace propagation — context is lost
producer.send(ProducerRecord("orders", orderData))  // trace context not included

// WITH trace propagation — context travels with the message
val headers = mutableMapOf<String, String>()
val propagator = GlobalOpenTelemetry.getPropagators().textMapPropagator
propagator.inject(Context.current(), headers) { map, key, value -> map[key] = value }

val record = ProducerRecord<String, ByteArray>("orders", null, orderData).also { rec ->
    headers.forEach { (key, value) ->
        rec.headers().add(key, value.toByteArray())
    }
}
producer.send(record)
On the consumer side, you need to extract it:
import io.opentelemetry.api.GlobalOpenTelemetry
import io.opentelemetry.api.trace.SpanKind
import io.opentelemetry.context.Context
import io.opentelemetry.context.propagation.TextMapGetter

val headerGetter = TextMapGetter<Headers> {
    headers, key -> headers.lastHeader(key)?.value()?.let { String(it) }
}

fun processMessage(record: ConsumerRecord<String, ByteArray>) {
    val propagator = GlobalOpenTelemetry.getPropagators().textMapPropagator
    val parentContext = propagator.extract(Context.current(), record.headers(), headerGetter)

    val span = tracer.spanBuilder("orders.process")
        .setParent(parentContext)
        .setSpanKind(SpanKind.CONSUMER)
        .startSpan()

    span.use {
        it.setAttribute("messaging.system", "kafka")
        it.setAttribute("messaging.destination", record.topic())
        it.setAttribute("messaging.kafka.partition", record.partition().toLong())
        // process the message...
    }
}
This gives you a connected trace. The consumer span becomes a child of the producer span, and you can see the full flow from the original HTTP request all the way through the queue to the final processing.
The Problem With Long-Running Consumers
There’s a subtler issue that trips up most teams: span lifetime vs. message processing time.
When you have a consumer that runs forever, pulling messages in a loop, you need to decide where your spans begin and end. The instinctive approach — one span for the entire consumer loop — is wrong. It produces a single span that runs for hours with no useful information inside it.
The correct model is one span per message:
fun consumeLoop(consumer: KafkaConsumer<String, ByteArray>) {
    while (true) {
        val records = consumer.poll(Duration.ofMillis(100))
        for (record in records) {
            // Extract context from this specific message
            val parentContext = propagator.extract(
                Context.current(), record.headers(), headerGetter
            )

            // New span for each message — linked to producer context
            val span = tracer.spanBuilder("order.process")
                .setParent(parentContext)
                .setSpanKind(SpanKind.CONSUMER)
                .startSpan()

            try {
                span.makeCurrent().use {
                    handleOrder(record.value())
                    span.setStatus(StatusCode.OK)
                }
            } catch (e: Exception) {
                span.recordException(e)
                span.setStatus(StatusCode.ERROR)
            } finally {
                span.end()
            }
        }
    }
}
Each message gets its own trace branch, rooted in the original producer context. This means you can search for all spans related to a specific order ID, whether they happened in an HTTP handler, a Kafka consumer, or a background worker.
Broken Causality in Fan-Out Patterns
Things get more complex when one message triggers multiple downstream messages. Say an order.created event causes three separate messages: one to inventory, one to payments, one to notifications.
In a naive implementation, each of those downstream traces is completely disconnected. In your tracing backend, you’ll see four separate traces with no visible relationship.
The solution is to use span links — a way to express relationships between spans across different traces:
import io.opentelemetry.api.trace.SpanContext
import io.opentelemetry.api.trace.TraceFlags
import io.opentelemetry.api.trace.TraceState

fun handleOrderCreated(record: ConsumerRecord<String, ByteArray>) {
    val parentContext = propagator.extract(
        Context.current(), record.headers(), headerGetter
    )
    val parentSpanContext = Span.fromContext(parentContext).spanContext

    // Create a link back to the original order event
    val span = tracer.spanBuilder("inventory.reserve")
        .addLink(parentSpanContext)
        .setSpanKind(SpanKind.PRODUCER)
        .startSpan()

    span.use {
        val orderId = objectMapper.readTree(record.value())["id"].asText()
        sendInventoryMessage(orderId)
    }
}
Span links are supported in Jaeger and Tempo but not all backends render them well. Check your tracing backend’s documentation before relying on them heavily.
Timing and Clock Skew
One thing that will confuse you: the timestamps in your async traces will look wrong.
A message published at 10:00:00 might appear in the trace as being processed at 09:59:58 — two seconds before it was sent. This is clock skew between your producer and consumer hosts. It’s normal, but it makes waterfall views in tracing UIs very confusing.
The practical solution: don’t rely on absolute timestamps for async spans. Use the messaging.kafka.offset and messaging.kafka.partition attributes to establish ordering. And document to your team that async span timing is approximate.
Attributes That Actually Help
When you’re debugging a slow consumer in production, these are the attributes you’ll wish you had:
span.setAttribute("messaging.system", "kafka")
span.setAttribute("messaging.destination", topic)
span.setAttribute("messaging.operation", "process")
span.setAttribute("messaging.kafka.partition", partition.toLong())
span.setAttribute("messaging.kafka.offset", offset)
span.setAttribute("messaging.kafka.consumer_group", groupId)
// Business context
span.setAttribute("order.id", orderId)
span.setAttribute("order.amount", amount)
span.setAttribute("order.currency", currency)
The messaging.* attributes follow the OpenTelemetry semantic conventions for messaging systems. Following them means your spans will be compatible with any OTel-aware tooling.
The Pragmatic Approach
If you’re retrofitting tracing into an existing system with many consumers, don’t try to fix everything at once. Prioritize:
- High-volume, high-value topics first — payment events, order events, anything that causes customer-facing issues
- Topics where you’ve had incidents — instrument where the pain is
- Fan-out points — anywhere one message produces many downstream messages is a blind spot worth fixing
Async observability is genuinely harder than synchronous tracing, but the gap is bridgeable. The teams I work with who invest in it find that their mean time to diagnosis drops significantly — because they can finally follow a single customer interaction across every service it touches, queue or no queue.