Your application produces thousands of log lines per second. During an incident, you SSH into the box and run grep "error" app.log | tail -100. You get 100 lines that look like this:
2026-05-22 14:32:01 ERROR Something went wrong processing request for user 4521
2026-05-22 14:32:01 ERROR Failed to connect to database
2026-05-22 14:32:02 ERROR Timeout waiting for response from payment-service
Which user was affected? Which request ID? Which instance? What was the trace ID? You don’t know. You’re parsing English sentences with your eyes, and you’ll spend the next 20 minutes correlating timestamps across three different services.
This is the cost of unstructured logging. And in distributed systems, it’s a cost you can’t afford.
What Structured Logging Actually Means
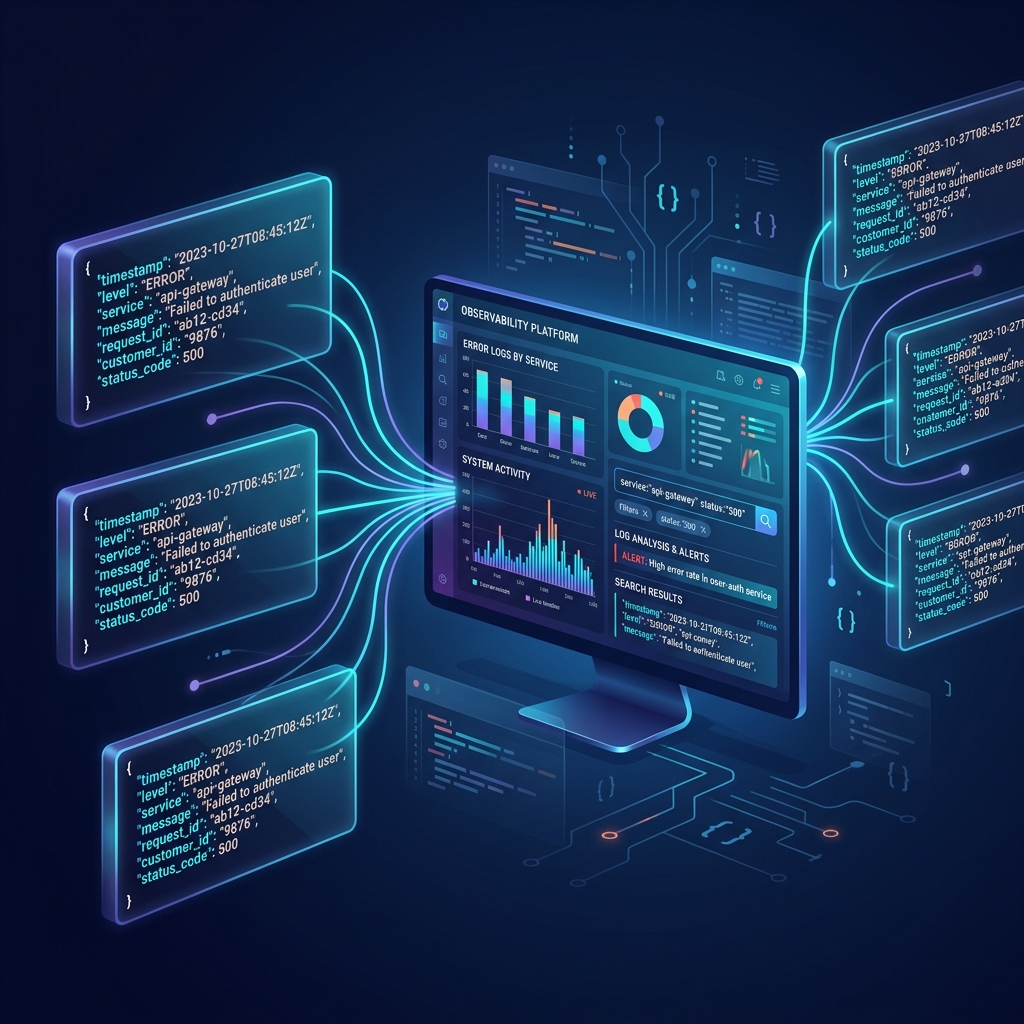
Structured logging means every log entry is a machine-parseable data structure — typically JSON — instead of a human-written sentence. The difference is fundamental:
Unstructured:
2026-05-22 14:32:01 ERROR Failed to process order 8834 for user 4521: connection timeout to payment-service after 5000msStructured:
{
  "timestamp": "2026-05-22T14:32:01.342Z",
  "level": "ERROR",
  "logger": "com.app.order.OrderService",
  "message": "Failed to process order",
  "service": "order-service",
  "instance": "order-service-7b4d9-xk2n1",
  "order_id": "8834",
  "user_id": "4521",
  "error_type": "ConnectionTimeoutException",
  "dependency": "payment-service",
  "timeout_ms": 5000,
  "trace_id": "a1b2c3d4e5f6a7b8c9d0e1f2a3b4c5d6",
  "span_id": "1a2b3c4d5e6f7a8b"
}
The first version is optimized for a human reading a single log line. The second is optimized for a machine querying millions of them. In a production system with 50 services, the second version is the only one that scales.
Setting Up Structured Logging in Kotlin
Most JVM applications use SLF4J with Logback. The default PatternLayout produces unstructured text. Switching to structured output requires a JSON encoder. Logstash Logback Encoder is the standard choice.
Add the dependency (Gradle):
// build.gradle.kts
dependencies {
    implementation("net.logstash.logback:logstash-logback-encoder:7.4")
    implementation("ch.qos.logback:logback-classic:1.4.14")
}
Configure Logback for JSON output:
<!-- logback.xml -->
<configuration>
    <appender name="STDOUT" class="ch.qos.logback.core.ConsoleAppender">
        <encoder class="net.logstash.logback.encoder.LogstashEncoder">
            <includeMdcKeyName>trace_id</includeMdcKeyName>
            <includeMdcKeyName>span_id</includeMdcKeyName>
            <includeMdcKeyName>request_id</includeMdcKeyName>

            <!-- Always include service metadata -->
            <customFields>
                {"service":"order-service","environment":"${ENV:-dev}"}
            </customFields>
        </encoder>
    </appender>

    <root level="INFO">
        <appender-ref ref="STDOUT" />
    </root>
</configuration>
From this point on, every log.info(...) call produces a JSON line instead of a text line. No code changes required — the migration is purely configuration.
The MDC Pattern: Adding Context Without Changing Every Log Call
The Mapped Diagnostic Context (MDC) is the mechanism that makes structured logging powerful. It lets you attach key-value pairs to the current thread, and every log statement on that thread automatically includes them.
import org.slf4j.LoggerFactory
import org.slf4j.MDC

class RequestFilter : Filter() {
    override fun doFilter(
        request: HttpServletRequest,
        response: HttpServletResponse,
        chain: FilterChain
    ) {
        try {
            MDC.put("request_id", request.getHeader("X-Request-ID") ?: generateRequestId())
            MDC.put("user_id", extractUserId(request))
            MDC.put("client_ip", request.remoteAddr)

            chain.doFilter(request, response)
        } finally {
            MDC.clear()  // Always clean up — MDC is thread-local
        }
    }
}
Now every log statement in the request chain — whether it’s in your controller, service, or repository — automatically includes request_id, user_id, and client_ip. Your developers don’t need to remember to pass these values around.
class OrderService {
    private val log = LoggerFactory.getLogger(OrderService::class.java)

    fun processOrder(orderId: String) {
        log.info("Processing order", kv("order_id", orderId))

        try {
            val result = paymentClient.charge(orderId)
            log.info("Payment completed",
                kv("order_id", orderId),
                kv("payment_id", result.paymentId),
                kv("amount", result.amount))
        } catch (e: Exception) {
            log.error("Payment failed",
                kv("order_id", orderId),
                kv("error_type", e.javaClass.simpleName),
                kv("error_message", e.message))
            throw e
        }
    }
}
The output includes both the explicit fields and the MDC context:
{
  "timestamp": "2026-05-22T14:32:01.342Z",
  "level": "INFO",
  "message": "Payment completed",
  "order_id": "8834",
  "payment_id": "pay_9x8w7v",
  "amount": 129.99,
  "request_id": "req-a1b2c3d4",
  "user_id": "4521",
  "client_ip": "203.0.113.42",
  "service": "order-service",
  "trace_id": "a1b2c3d4e5f6a7b8c9d0e1f2a3b4c5d6"
}
Correlating Logs with Traces: The Missing Link
Most teams have tracing and logging set up independently. The logs go to one system, traces go to another, and when something breaks, you’re mentally correlating timestamps between them.
The fix is simple: inject the OpenTelemetry trace context into your logging MDC so every log line carries the trace_id and span_id.
import io.opentelemetry.api.trace.Span
import io.opentelemetry.context.Context

class OtelLoggingFilter : Filter() {
    override fun doFilter(
        request: HttpServletRequest,
        response: HttpServletResponse,
        chain: FilterChain
    ) {
        val span = Span.fromContext(Context.current())
        val spanContext = span.spanContext

        if (spanContext.isValid) {
            MDC.put("trace_id", spanContext.traceId)
            MDC.put("span_id", spanContext.spanId)
            MDC.put("trace_flags", spanContext.traceFlags.asHex())
        }

        try {
            chain.doFilter(request, response)
        } finally {
            MDC.remove("trace_id")
            MDC.remove("span_id")
            MDC.remove("trace_flags")
        }
    }
}
If you’re using the OpenTelemetry Java Agent, this injection happens automatically via the opentelemetry-logback-mdc-1.0 integration — no manual code required. Just add it to your classpath:
// build.gradle.kts
dependencies {
    runtimeOnly("io.opentelemetry.instrumentation:opentelemetry-logback-mdc-1.0-alpha:2.11.0-alpha")
}
With this in place, you can click on an error log in Grafana Loki and jump directly to the corresponding trace in Tempo. Or search for all logs belonging to a specific trace. The trace_id is the bridge.
What to Log and What Not to Log
The biggest mistake teams make with structured logging isn’t the format — it’s logging too much or too little. Here’s a practical framework:
Always log:
- Request boundaries — when a request enters and leaves your service
- External calls — every HTTP call, database query, or message publish (with latency)
- Business events — order created, payment processed, user registered
- Errors and exceptions — with full context (what was the input? what was the state?)
- State transitions — circuit breaker opened, cache evicted, feature flag toggled
Never log:
- Sensitive data — passwords, tokens, credit card numbers, PII without masking
- High-frequency loops — logging inside a
forloop processing 10,000 items will drown everything else - Redundant information — if it’s already in a span attribute, don’t duplicate it in a log
- Success paths at DEBUG in production — unless you can dynamically toggle log levels per request
Log levels that mean something:
| Level | When to use it |
|---|---|
ERROR | Something failed that should not have failed. Requires investigation. |
WARN | Something unexpected happened but the system recovered. Circuit breaker opened, retry succeeded. |
INFO | Normal business events. Request processed, order created, payment completed. |
DEBUG | Detailed diagnostic information. Off by default in production. |
If you can’t immediately tell whether a log line is ERROR or WARN, use this test: would you page someone at 3am for this? If yes, it’s ERROR. If no, it’s WARN or INFO.
Handling Coroutines and Virtual Threads
MDC is thread-local, which creates problems with Kotlin coroutines and Java virtual threads. When execution jumps between threads, the MDC context gets lost.
Kotlin Coroutines — use MDCContext:
import kotlinx.coroutines.slf4j.MDCContext
import kotlinx.coroutines.withContext

suspend fun processOrderAsync(orderId: String) {
    MDC.put("order_id", orderId)

    // MDCContext propagates MDC values into the coroutine
    withContext(MDCContext()) {
        log.info("Starting async processing")  // order_id is present

        val result = async { paymentClient.chargeAsync(orderId) }
        val inventory = async { inventoryClient.reserveAsync(orderId) }

        result.await()
        inventory.await()

        log.info("Async processing complete")  // order_id still present
    }
}
Java 21+ Virtual Threads — wrap the executor:
import java.util.concurrent.Executors

val executor = Executors.newVirtualThreadPerTaskExecutor()

fun submitWithMdc(task: Runnable) {
    val contextMap = MDC.getCopyOfContextMap() ?: emptyMap()
    executor.submit {
        MDC.setContextMap(contextMap)
        try {
            task.run()
        } finally {
            MDC.clear()
        }
    }
}
If you don’t handle this, you’ll get log entries in your async code paths with no trace_id, request_id, or user_id — exactly the entries you’ll need most during debugging.
Sensitive Data: Log Masking and Redaction
Logging user data without masking is both a security risk and a compliance violation. Build redaction into your logging pipeline, not into every log call.
With the Logstash encoder, configure field masking directly in Logback:
<encoder class="net.logstash.logback.encoder.LogstashEncoder">
    <jsonGeneratorDecorator
        class="net.logstash.logback.mask.MaskingJsonGeneratorDecorator">
        <defaultMask>****</defaultMask>
        <path>email</path>
        <path>password</path>
        <path>credit_card</path>
        <path>ssn</path>
    </jsonGeneratorDecorator>
</encoder>
Any field named email, password, credit_card, or ssn will automatically be replaced with **** in the output — regardless of where in the code the log statement is.
Querying Structured Logs: From grep to LogQL
Once your logs are structured, you unlock the ability to query them like a database. If you’re using Grafana Loki, here’s what becomes possible:
# Find all errors for a specific user in the last hour
{service="order-service"} | json | user_id="4521" | level="ERROR"

# Calculate error rate per service over 5 minutes
sum by (service) (
  count_over_time({level="ERROR"} | json [5m])
)

# Find the slowest external calls
{service="order-service"} | json | dependency != "" | timeout_ms > 3000

# Trace a single request across all services
{} | json | request_id="req-a1b2c3d4"
Compare this to what you’d need with unstructured logs:
# Good luck with this
grep "req-a1b2c3d4" /var/log/*.log | grep -i error | awk '{print $1, $2, $NF}'
The structured version is faster, more precise, and works across millions of log lines in seconds.
The Cost Problem: Controlling Log Volume
Structured logging with rich context means larger log entries. At scale, this translates directly to storage and ingestion costs. Here’s how to manage it:
1. Use log levels aggressively. Run INFO in production, DEBUG only when actively investigating. This alone can reduce volume by 60-80%.
2. Sample high-frequency events. If you’re logging every health check or every cache hit, sample them:
import java.util.concurrent.atomic.AtomicLong

class SampledLogger(
    private val delegate: Logger,
    private val sampleRate: Long = 100
) {
    private val counter = AtomicLong(0)

    fun infoSampled(message: String, vararg args: Any?) {
        if (counter.incrementAndGet() % sampleRate == 0L) {
            delegate.info(message, *args)
        }
    }
}
3. Drop fields you never query. If you’re logging stack_trace on every entry but only querying it on errors, configure your pipeline to strip it from non-error entries.
4. Set retention policies by level. Keep ERROR logs for 90 days, WARN for 30 days, INFO for 7 days. Your log aggregator almost certainly supports this.
The Checklist
Before considering your structured logging production-ready, verify:
- Every log entry is valid JSON (or your chosen structured format)
trace_idandspan_idare present on every log lineservice,instance, andenvironmentare included as static fields- Sensitive fields are masked or redacted
- MDC is properly propagated across async boundaries (coroutines, virtual threads)
- Log levels are meaningful and consistent across services
- You can query logs by
trace_idin your log aggregator - You can jump from a log entry to the corresponding trace (and vice versa)
- You have retention policies configured by log level
- Your team has agreed on a shared schema for common fields
Logs are the third pillar of observability — alongside metrics and traces. But unlike metrics, which are aggregated, and traces, which are sampled, logs are often the only complete record of what happened. Make them count.